Let’s Look at the Genes’ Social Life
“A gene regulatory network is a set of genes, or parts of genes, that interact with each other to control a specific cell function. Gene regulatory networks are important in development, differentiation and responding to environmental cues.” Nature
Click Here For the Latest Research and Reviews
A note for the general audience:
Balance Theory: From Psychology to Cancer Dynamics
Members

Behrouz Askari
Physics PhD Student
Samin Tajik
Ph.D. candidate in computational biophysics at Brock University, Canada
Hosein Masoomy

Nastaran Allahyari

Mahsa Bagheri

Mina Zamani

Abbas K. Rizi
Ph.D. candidate at the Department of Computer Science, School of Science, Aalto University

Amirhossein Shirazi
Postdoc at Queen's UniversityIntroduction
Behavior of a cell as a complex system is not solely describable by integrating over the behavior of its constituent parts, the genes. To study the emergent collective behavior of the genes in a cell in the case of Breast Cancer, we have looked through the gene regulatory network of the cell which we have inferred from the RNA-Seq data. By applying Balance Theory, we we have searched for the network properties of the genes social life.
Cancer is commonly known as a disease of the genes and there has been a huge effort to find the effective genes for different cancers. These approaches to control/cure cancer, however, have not been that much successful. In fact, the great difference between cancer and other genetic disease is the effect of genes interaction on the regulation of the genes. How the up-regulation of gene A will result in the upregulation/downregulation of gene B. In this project, instead of following the prevalent reductionist methods, we have used the approach of Complex Systems. We are interested in studying collective behavior among the genes. We have inferred regulatory interactions between the genes and by representing each gene as a node and the interaction between each two of them as a link, we have instructed the interaction network, the network is weighted and signed showing that the interactions between the genes are not identical.
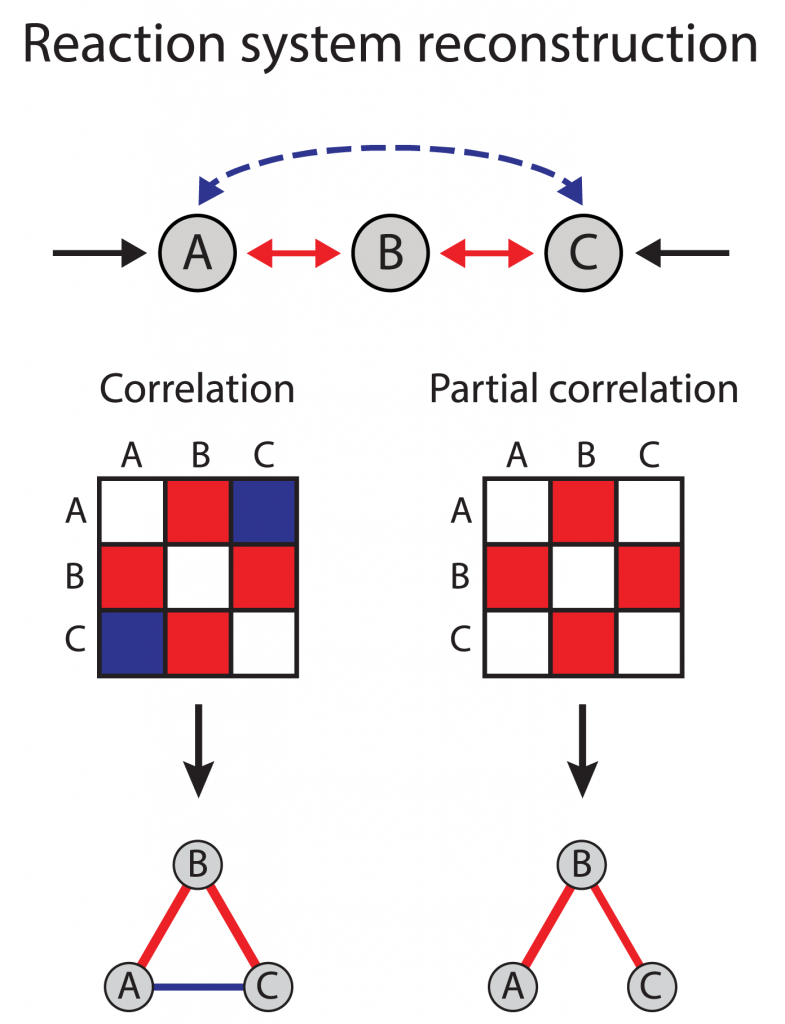
The interaction between genes named A, B, C has been shown in the picture at the right.
Undirected Pairwise Maximum-Entropy Probability Model
we restrict ourselves to a probabilistic model with terms up to second order, which we derive for continuous, real-valued variables.
Assuming the interactions to be pairwise, using the Principle of Maximum Entropy, we can acquire the gene network by considering the mean and correlation of the experimental data set. We work on normal and cancerous genes data set to infer the network of these two groups. The issue of whether the upregulation of a gene is impressed by the up/down regulation of others is our concern.
We want to make a probability distribution function for a sample of biological data set which needs to be able to describe the whole data. As we know a PDF (probability distribution function) has its own parameters. In accordance with Principle of Maximum Entropy, the object is to find a PDF among a number of PDFs that maximize entropy. PDF parameters can be obtained by Principle of Maximum Entropy and the method of Lagrange multipliers.
We are interested in finding whether or to what extent there is a relationship between each pair of genes. Using their correlation coefficient will give misleading results if there is another, confounding, gene that is related to both genes of interest. This misleading information can be avoided by controlling for the confounding genes, which is done by computing the partial correlation coefficient.
There are some subjects like the dynamics of the network that can be discussed when the networks were inferred. According to balance theory, frustrated triangles are expected when three genes are connected to each other. Suppose A, B, C are connected and make a triangle if A up-regulates and B down-regulate what will happen for C?
The result can be interpreted as normal (healthy) network is more dynamics rather than cancerous and healthy genes are able to adapt to cell changes easily, conversely a cancerous gene stays in a fixed state. The healthy network tries to lessen the energy to reach the global minimum of a system but cancerous network sticks in local minima, this is the cause of abnormal cell growth and division.
Other interesting and disputable questions can be the comparison of the dynamics of the network in the different stages of cancer or studying the gene network as a directed network in order to obtain more information from the genes interaction.
Data
The data of mRNA (expression level) of 20532 genes in the case of Breast Cancer (BRCA: Breast invasive carcinoma) has been downloaded from The Cancer Genome Atlas (TCGA) project. For each gene, there exists 114 normal and 764 cancerous samples and the measurement of the expression levels have done with the technique of RNA sequencing (RNA-Seq).
Get the data from here:
http://gdac.broadinstitute.org/runs/stddata__2016_01_28/data/BRCA/20160128/
Some of the main code:
In python: Jupyter Notebook
The interaction matrix, J:
To get J for the cancerous case click here and for the normal case, click here.
Citation:
K. Rizi A, Zamani M, Shirazi A, Jafari GR and Kertész J (2021) Stability of Imbalanced Triangles in Gene Regulatory Networks of Cancerous and Normal Cells. Front. Physiol. 11:573732. doi: 10.3389/fphys.2020.573732
Masoomy, Hosein, et al. “Topological Analysis of Interaction Patterns in Cancer-Specific Gene Regulatory Network: Persistent Homology Approach.” (2021).
If you use/ intend to use any of the gene regulatory network inference pipelines out there, it’s worth checking this benchmarking paper/ pipeline out:
https://www.nature.com/articles/s41592-019-0690-6
| Cite as: | arXiv:2010.05897 [q-bio.MN] |
Refs:
- Gene Expression Data Analysis – Cosma Shalizi
- Inverse statistical problems: from the inverse Ising problem to data science
H. Chau Nguyen, Riccardo Zecchina, Johannes Berg
arXiv:1702.01522 - Inferring Pairwise Interactions from Biological Data Using Maximum-Entropy Probability Models
Richard R. Stein, Debora S. Marks, Chris Sander
PLOSPublished: July 30, 2015, https://doi.org/10.1371/journal.pcbi.1004182 - منبع فارسی: استنباط شبکه تنظیم ژنی از دادههای تجربی